The board your Monday meeting runs on.
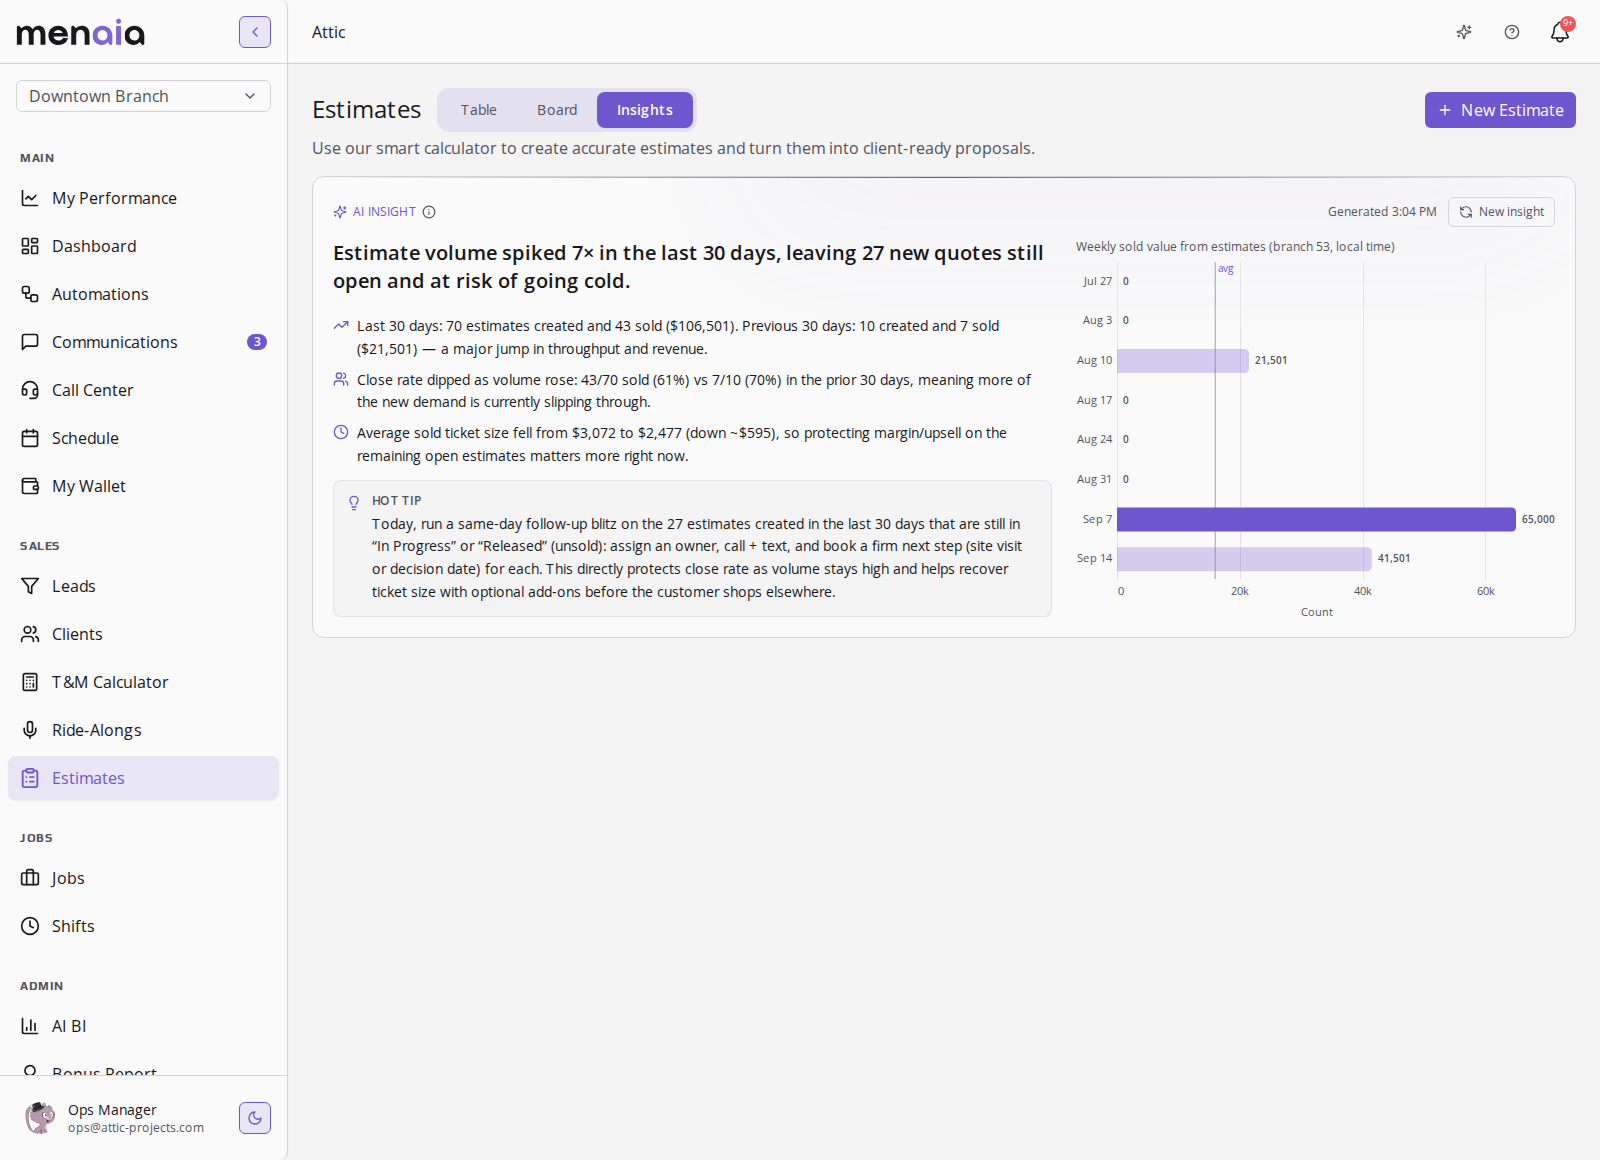
Estimate throughput, close rate and sold value. Which quotes are going cold before they close. One AI-written brief, refreshed from live data every day.
Built from records, not exports.
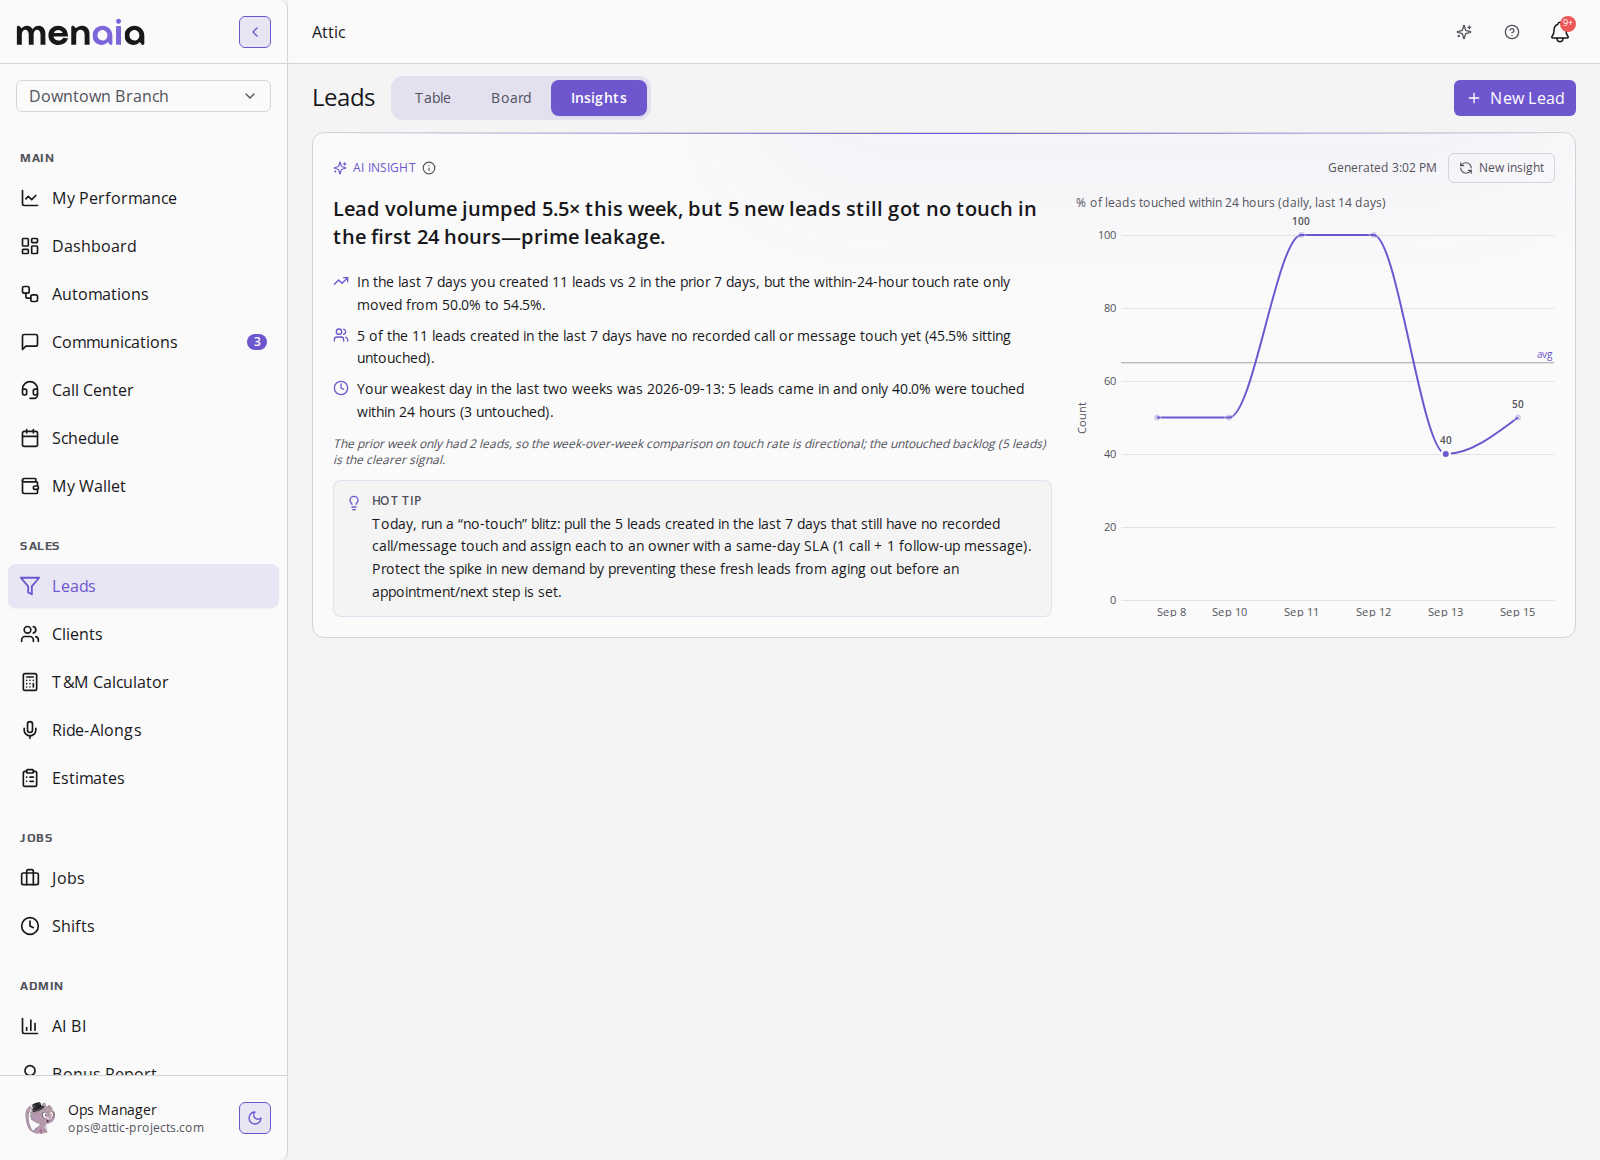
The Leads Insights tab reads 11 leads created this week against 2 the week before, and flags the 5 that got no touch in the first 24 hours. Every finding recomputes from live records. Nothing is pasted in from a spreadsheet.
Five KPIs that actually predict a bad month.
Not vanity numbers. These are the five that turn red before revenue does, and where each one lives in Menaia.
- 1Close rate over time
The direction beats the average. The Insights tab flagged the close rate slipping from 70% to 61% as volume spiked, before the month closed. Lives on the estimates Insights tab.
- 2Quotes going cold
Estimates still open after a demand spike, so a bottleneck has a number. The tab named 27 quotes sitting unsold after a 7x volume jump. Ask Meni to break it out by rep.
- 3Sold value week over week
A cooling week shows before the month closes. The weekly sold-value chart peaked at $65,000 the week the spike landed. Lives on the estimates Insights tab.
- 4Discount share of sold work
How much of what you sell carries a discount, and whether it buys the close. Lives in the insights feed as a dated finding.
- 5Review score trend
The direction of your reviews, not just the current average, so a slipping branch surfaces early. Lives on the performance pages.
Ask for a KPI you don't have yet.
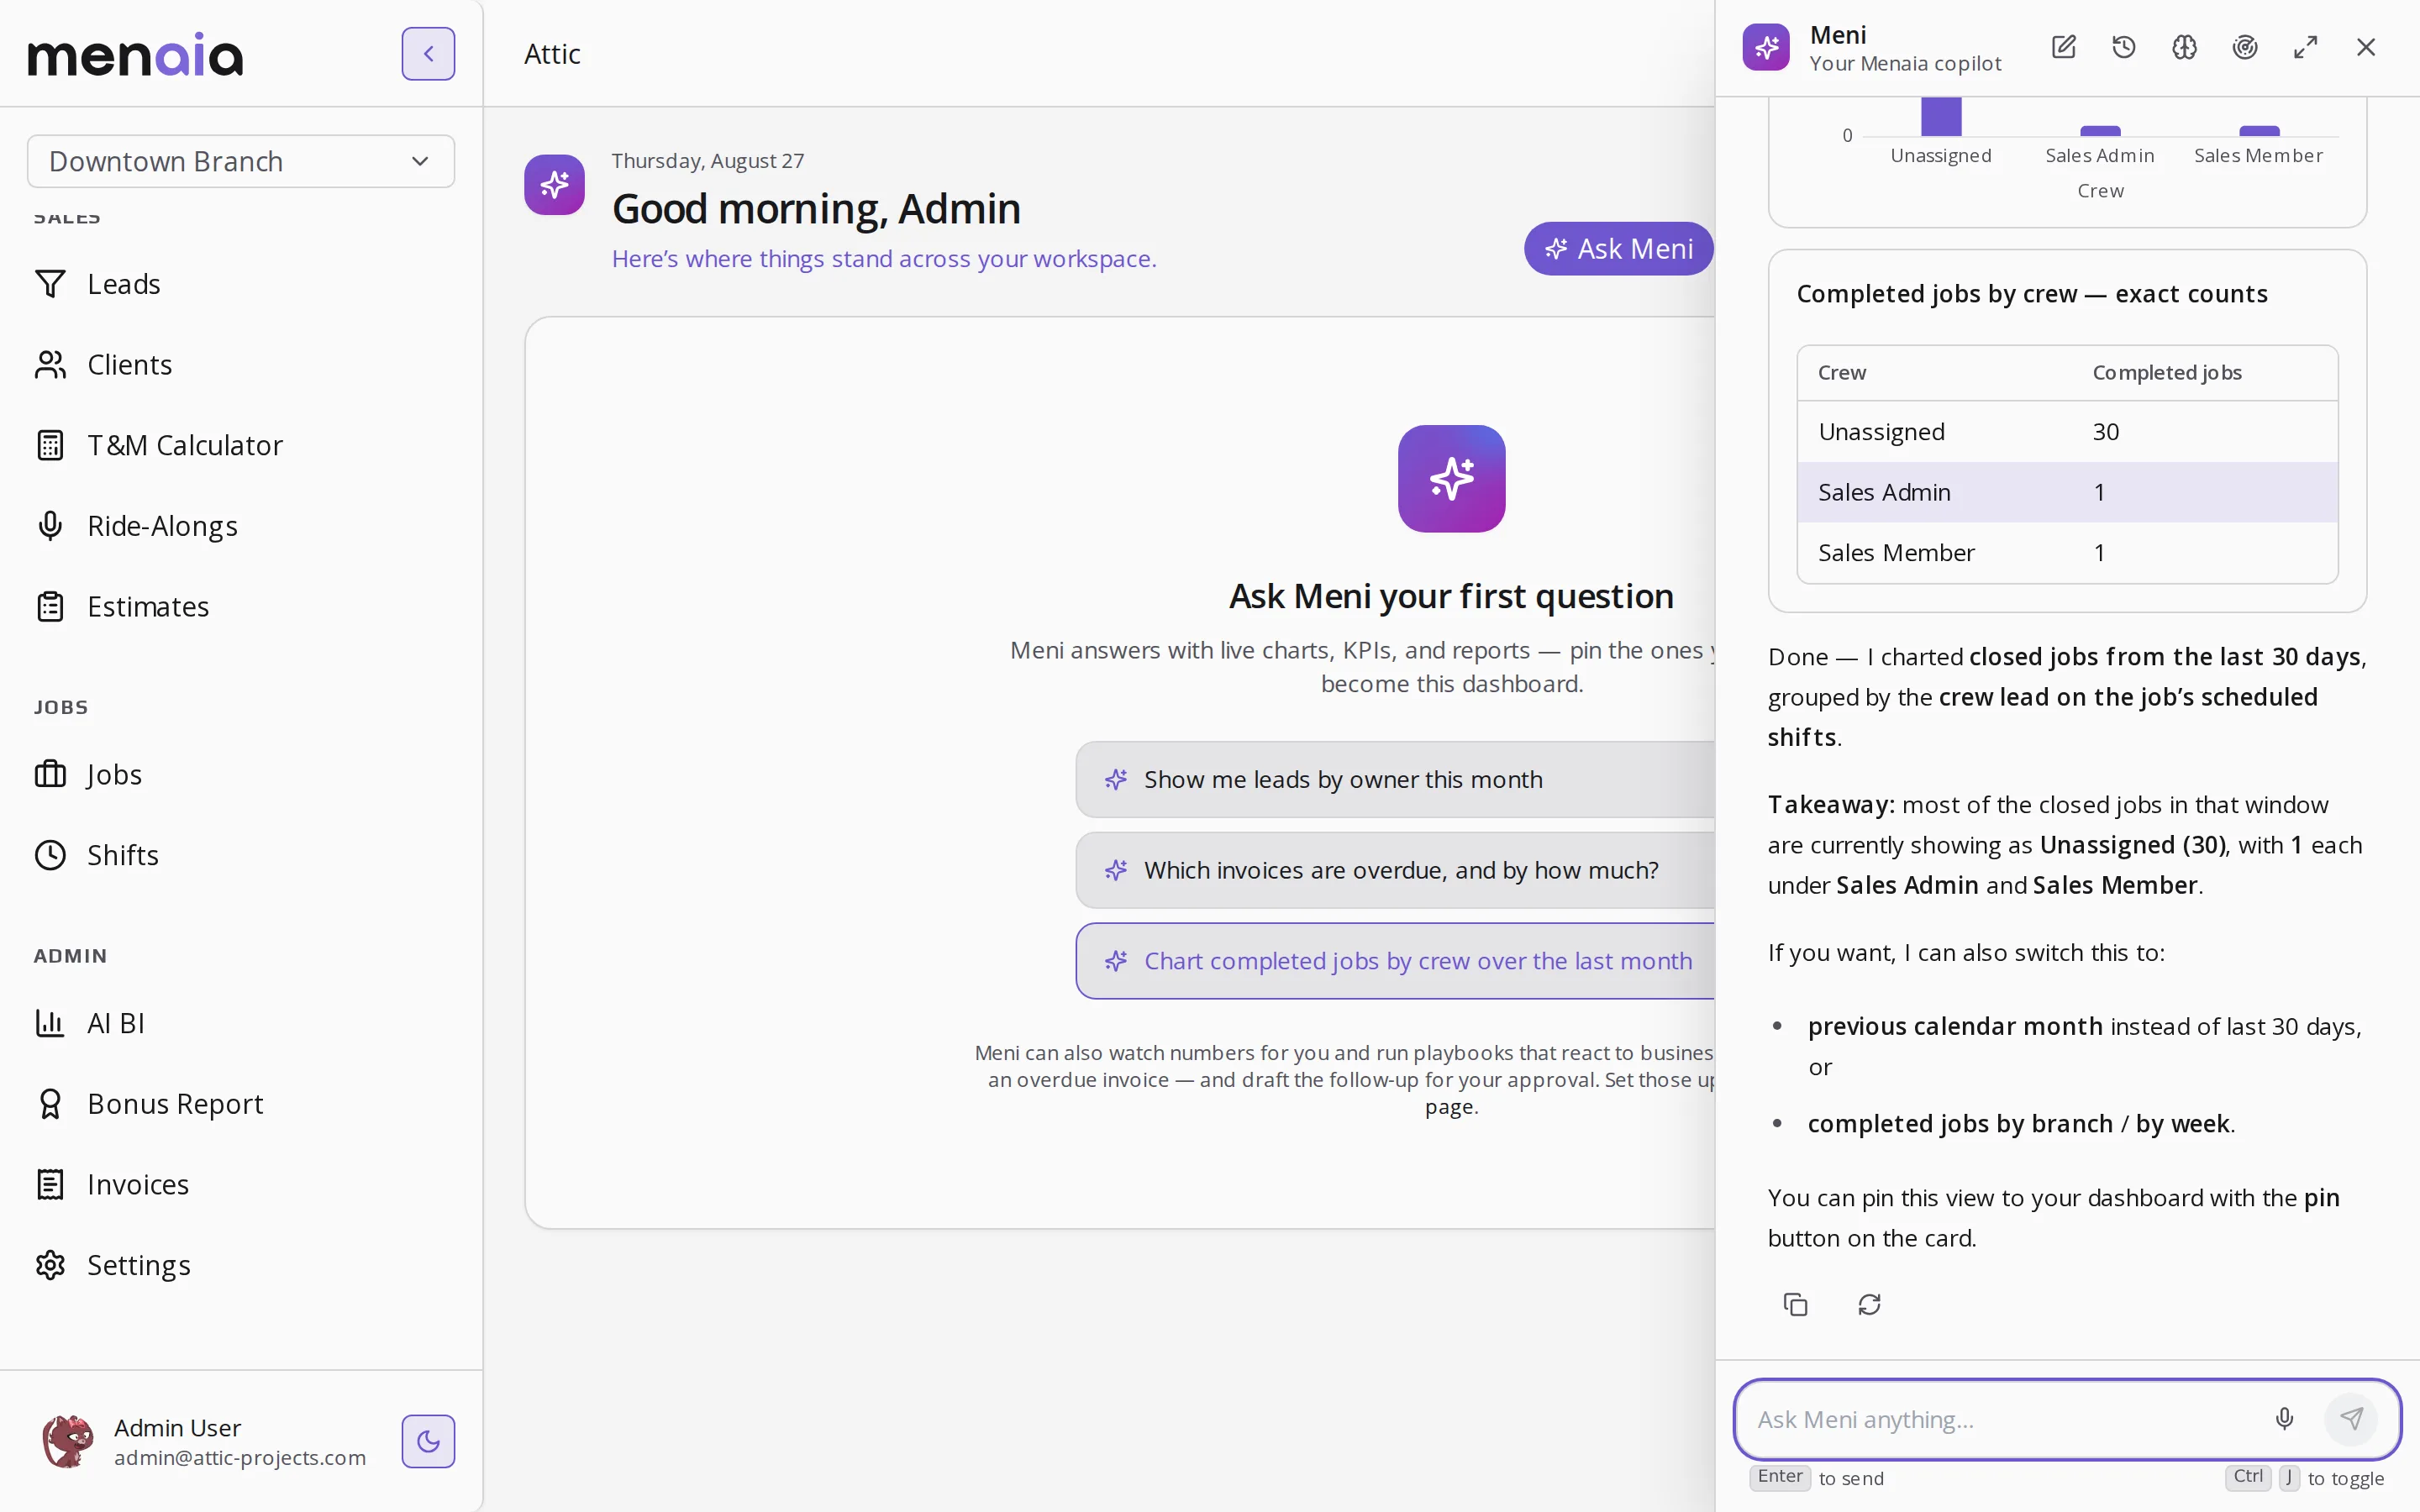
Type a question to Meni, get a chart, pin it, and the board grows. Meni is metered in tokens at one cent each. The boards themselves are a business tool and are never metered.
Running the board.
- Which KPIs come standard?
- Estimate throughput, close rate, sold value and average ticket, plus the leads at risk of going cold. Menaia surfaces them as dated AI findings on the Insights tab, each with its chart and a recommended next step.
- Can each branch have its own board?
- Yes. Every list has an Insights tab and Meni scopes to the branch you pick, so each branch reads its own throughput, close rate and sold value.
- How fresh is the data?
- It recomputes from live records. The capture was generated at 3:04 PM from the last 30 days: 70 estimates created and 43 sold.
Dig into discount share, pin Meni answers, track margin per job, and read the token rates.
See the board on your own branches
Thirty minutes with someone who ran crews. Bring your branches and we will build the Monday board live.
Select a time to continue