Findings, not charts.
Every day Menaia reads your sales and job data and writes up what changed. Not a dashboard you interrogate. Short findings with the evidence attached.
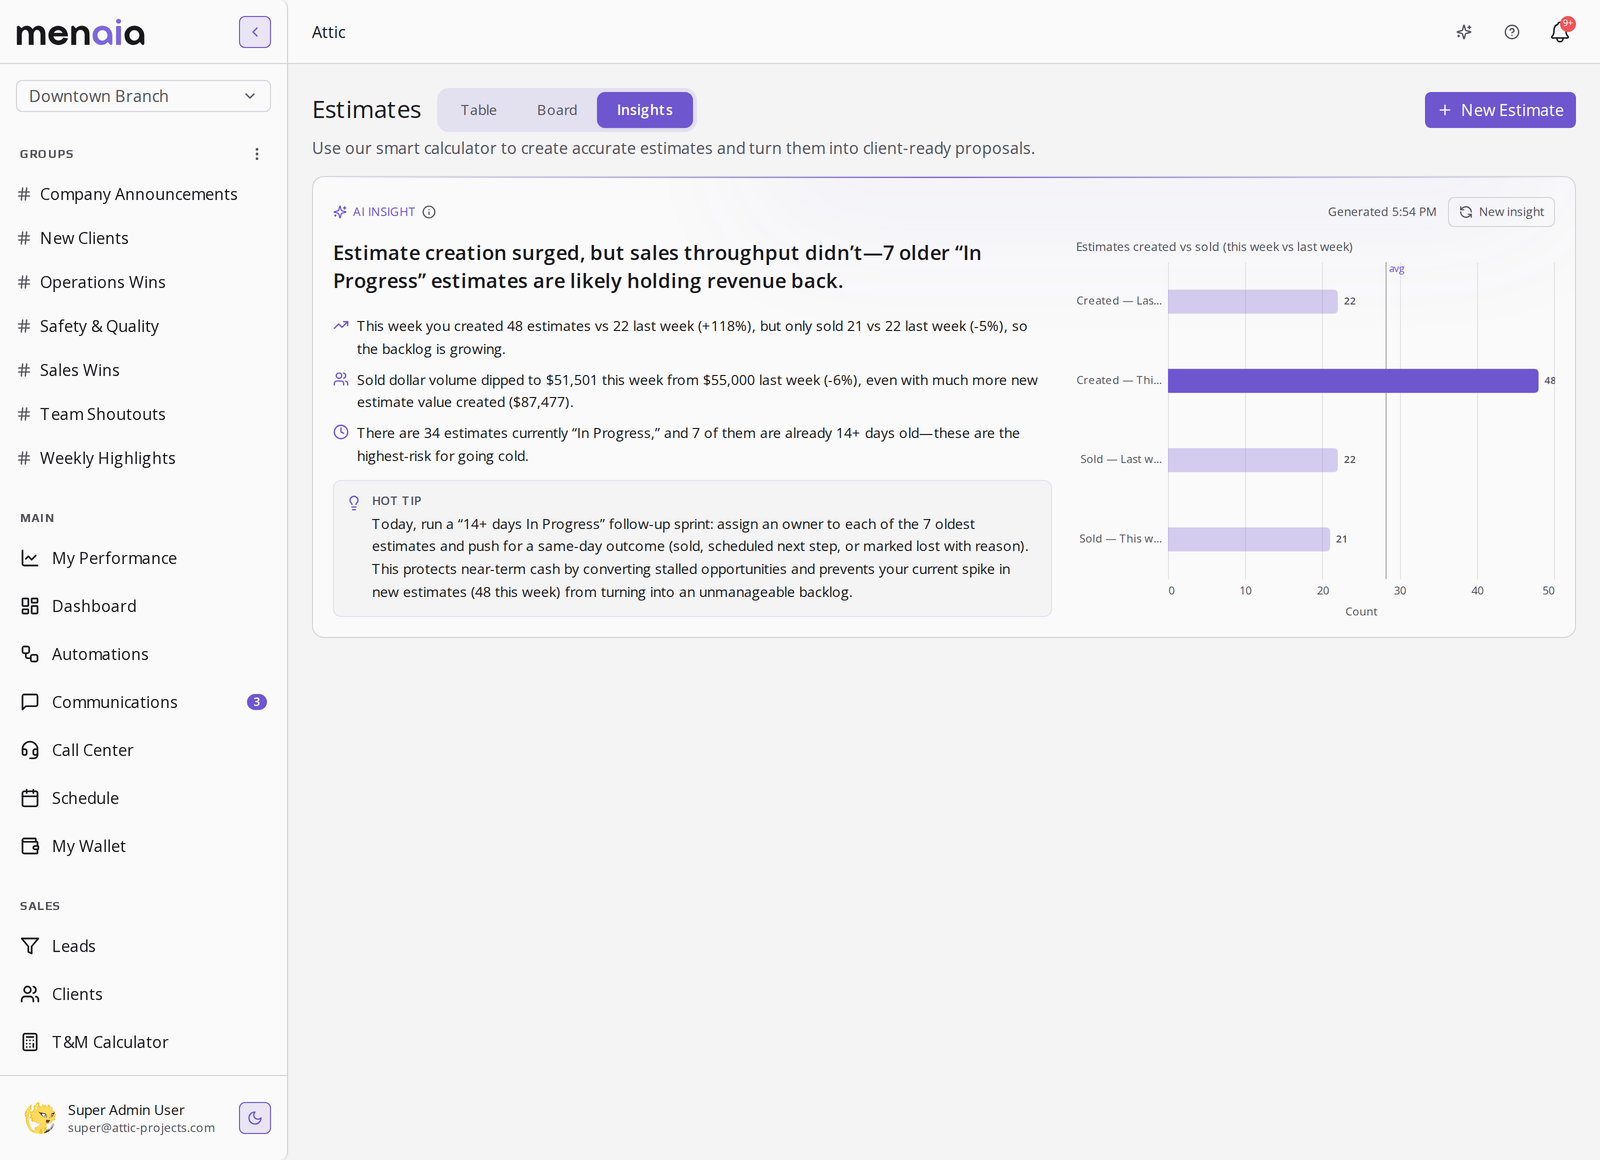
Read one real finding.
This is the finding from the capture, walked through the way the feed writes it.
- 1
This week the team created 48 estimates against 22 last week (+118%), but sold 21 against 22, so the backlog is growing.
- 2
Sold dollars dipped to $51,501 from $55,000, even with $87,477 of new estimate value created.
- 3
The conclusion: 34 estimates sit In Progress and 7 are already 14+ days old. The risk is follow-up on the older quotes, not new demand.
That paragraph is worth more than the chart it came from.
Where the findings come from.
Findings arrive dated, daily, newest first. Each one reads from a specific slice of your own records.
Feeds on estimate volume, sold value, and how long quotes sit open. A finding reads like: two-thirds of your unsold estimate dollars are sitting 31+ days old.
Feeds on results by branch over time. A finding names the mover, like San Diego pulling away as the company scaled.
Feeds on estimated hours against actual shift hours. A finding flags where jobs are running long and by how much.
From finding to fix
A finding is a starting point.
Open the underlying records behind any finding. The number is a link, not a claim.
Tell Meni to go further on any card and it answers from the same data. The finding becomes a conversation.
Pin the chart to a KPI board and it stays, refreshing on live data instead of expiring with the finding.
Insights, in plain terms.
- Is this the same as the KPI dashboard?
- No. Boards show state, insights explain change. The KPI board tells you closing ratio is 45%. The feed tells you why it moved.
- How often do insights generate?
- Daily, from your data. Findings arrive dated, newest first, with the evidence attached.
- Does it use tokens?
- Yes. Meni work is metered at one cent per token. The business tools it reads from are never metered.
The boards live in KPIs, you can ask Meni to go deeper, the labor overruns feed margin, and the token rates are published.
See a finding on your own data
Thirty minutes with someone who ran crews. Bring a quarter of estimates and we will show you what the feed catches.
Select a time to continue